Mathematica Plot “自制图例”
此文档为旧博客搬运。——2020.05.10
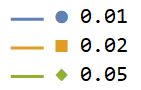
例如我们有很多条曲线(用实线画),相应有多组可对比的数据(用不同的符号Marker),这时候希望能够把图例 (legend)里面线和相应的符号放一起, 比如
要在 Mathematica 里面实现,我能想到的分别把线和符号画出来,然后放一起插入作为图例即可。要确定如下两点:
- 因为图很多,我们采用了默认的PlotStyle,让 MMA 自动给出不同的颜色,所以我们希望获取相关颜色列表,查了下,采用的是
ColorData[97, "ColorList"],见 https://mathematica.stackexchange.com/questions/54629/what-are-the-standard-colors-for-plots-in-mathematica-10 自然,可以在画线时指定样式:PlotStyle -> ColorData[97, "ColorList"]。 - 默认的 Marker 列表:
Graphics`PlotMarkers[],返回的是一对对图标(String)和尺寸列表,见 https://stackoverflow.com/questions/6037832/how-to-specify-a-particular-plot-marker-from-mathematicas-automatic-list-of-mar
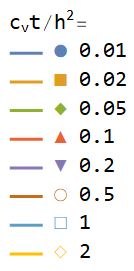
知道颜色和图标列表后,我们手动生成图例并将其放置进去即可:
tlist = {0.01, 0.02, 0.05, 0.1, 0.2, 0.5, 1, 2};
line = Line[{{0, 0}, {0.1, 0}}];
lgd =
 Column[Join[
   {" ", " ",
    "\!\(\*SubscriptBox[\(c\), \(v\)]\)t/\!\(\*SuperscriptBox[\(h\), \
\(2\)]\)="},
   MapThread[
    Row[{Graphics[{Directive[#1], Thick, line}, AspectRatio -> 1/50,
        ImageSize -> {20, 10}], " ", Style[#2, #1], " ",
       ToString[#3]}] &,
    {ColorData[97, "ColorList"][[1 ;; Length[tlist]]],
     Graphics`PlotMarkers[][[1 ;; Length[tlist], 1]], tlist}]
   ], Left]
注意,这里用简单 Graphics[{Line[...]}] 画出来的线上下有很大的空白,这里采用了 AspectRatio->1/50, ImageSize -> {20, 10} 来控制其大小,见 https://mathematica.stackexchange.com/questions/127272/why-is-graphics-adding-all-this-whitespace-above-and-below-a-simple-line?rq=1